Basics Of The Electrocardiogram (ECG)
Article Sections
Introduction
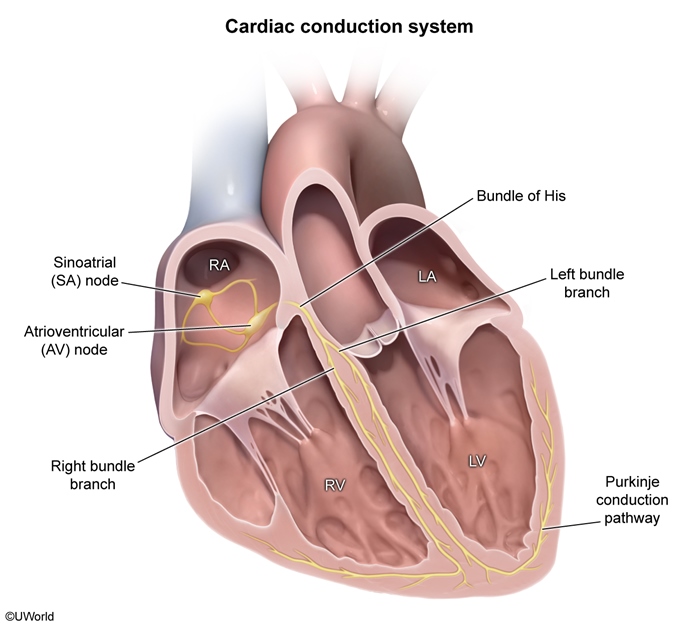
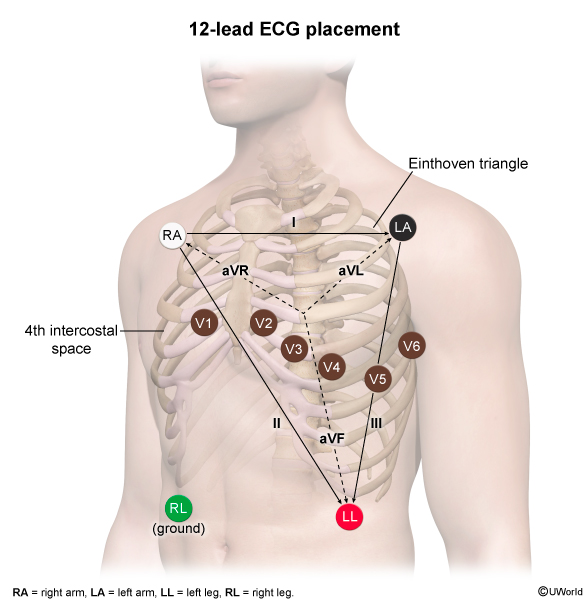
An electrocardiogram (ECG) is a critical tool used in the diagnosis of many cardiovascular conditions. Fundamentally, it is a graph of voltage vs time that tracks electrical activity traveling through the cardiac conduction system (Figure 1). A standard 12-lead ECG is collected using (Figure 2):
- 6 limb leads (I, II, III, aVL, aVR, aVF), which measure voltages traveling through the frontal (coronal) plane.
- 6 precordial leads (V1, V2, V3, V4, V5, V6), which measure voltages traveling through the horizontal (transverse) plane.
Measurement of voltages traveling through different areas of the heart facilitates the assessment of rhythm, conduction abnormalities, heart chamber size, and regional myocardial activity.
Cardiac cycle
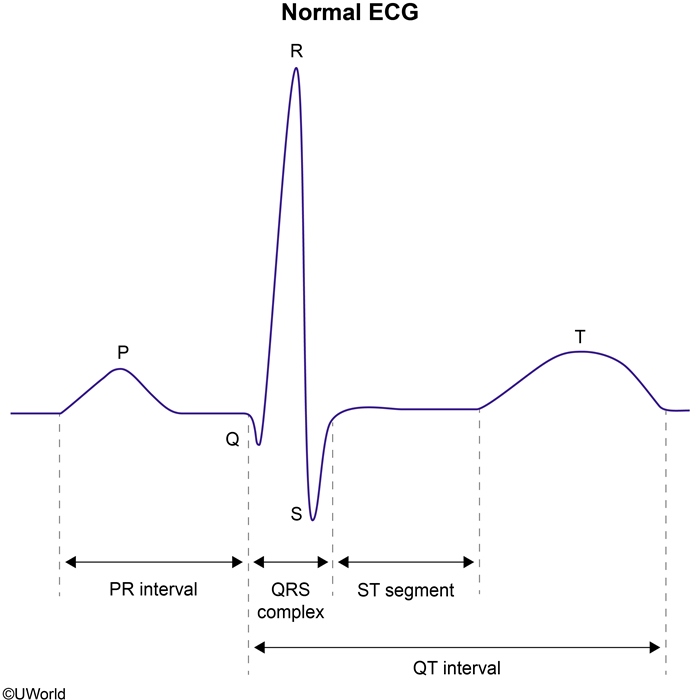
The typical voltage patterns created during each cardiac cycle are as follows (Figure 3):
- The P wave represents atrial depolarization.
Continue Learning with UWorld
Get the full Basics Of The Electrocardiogram (ECG) article plus rich visuals, real-world cases, and in-depth insights from medical experts, all available through the UWorld Medical Library.
Unlock Full AccessFigures
Images